Using Machine Learning and Deep Learning at pixel-level precision
Affiliated Organizations
Introduction
Background, motivation, and objectives of the study
Problem Statement
Research Objectives
Study Area
Geographic overview of the research site
Research Site
This study focuses on the USDA Beltsville Agricultural Research Center (BARC) in Beltsville, Maryland- a 6,600-acre USDA agricultural research facility located between the Atlantic Coastal Plain and the Piedmont Plateau. The site features diverse land cover, including cultivated fields, forests, wetlands, and infrastructure, providing a suitable agricultural landscape for predictive analysis.
Study Site
USDA Beltsville ARC
Location
Beltsville, Maryland
Fields
118
Years Covered
11 years
Dataset Overview
Multi-source remote sensing and environmental variables
Methodology
Research pipeline, seasonal design, and yield favorability
Models Compared
Classical machine learning vs. deep learning architectures
Random Forest
Classical MLXGBoost
Classical MLAttention Based CNN-LSTM
Deep LearningMethodology Flowchart

Seasonal Date Windows
Year-Wise Favorability Formula
where and represent the mean and standard deviation of crop , and denotes the average yield for crop in year across all fields.
Results
Interactive analyses across three evaluation frameworks
Representative Model Performance Comparisons
Section 1 of 3
Yield Map
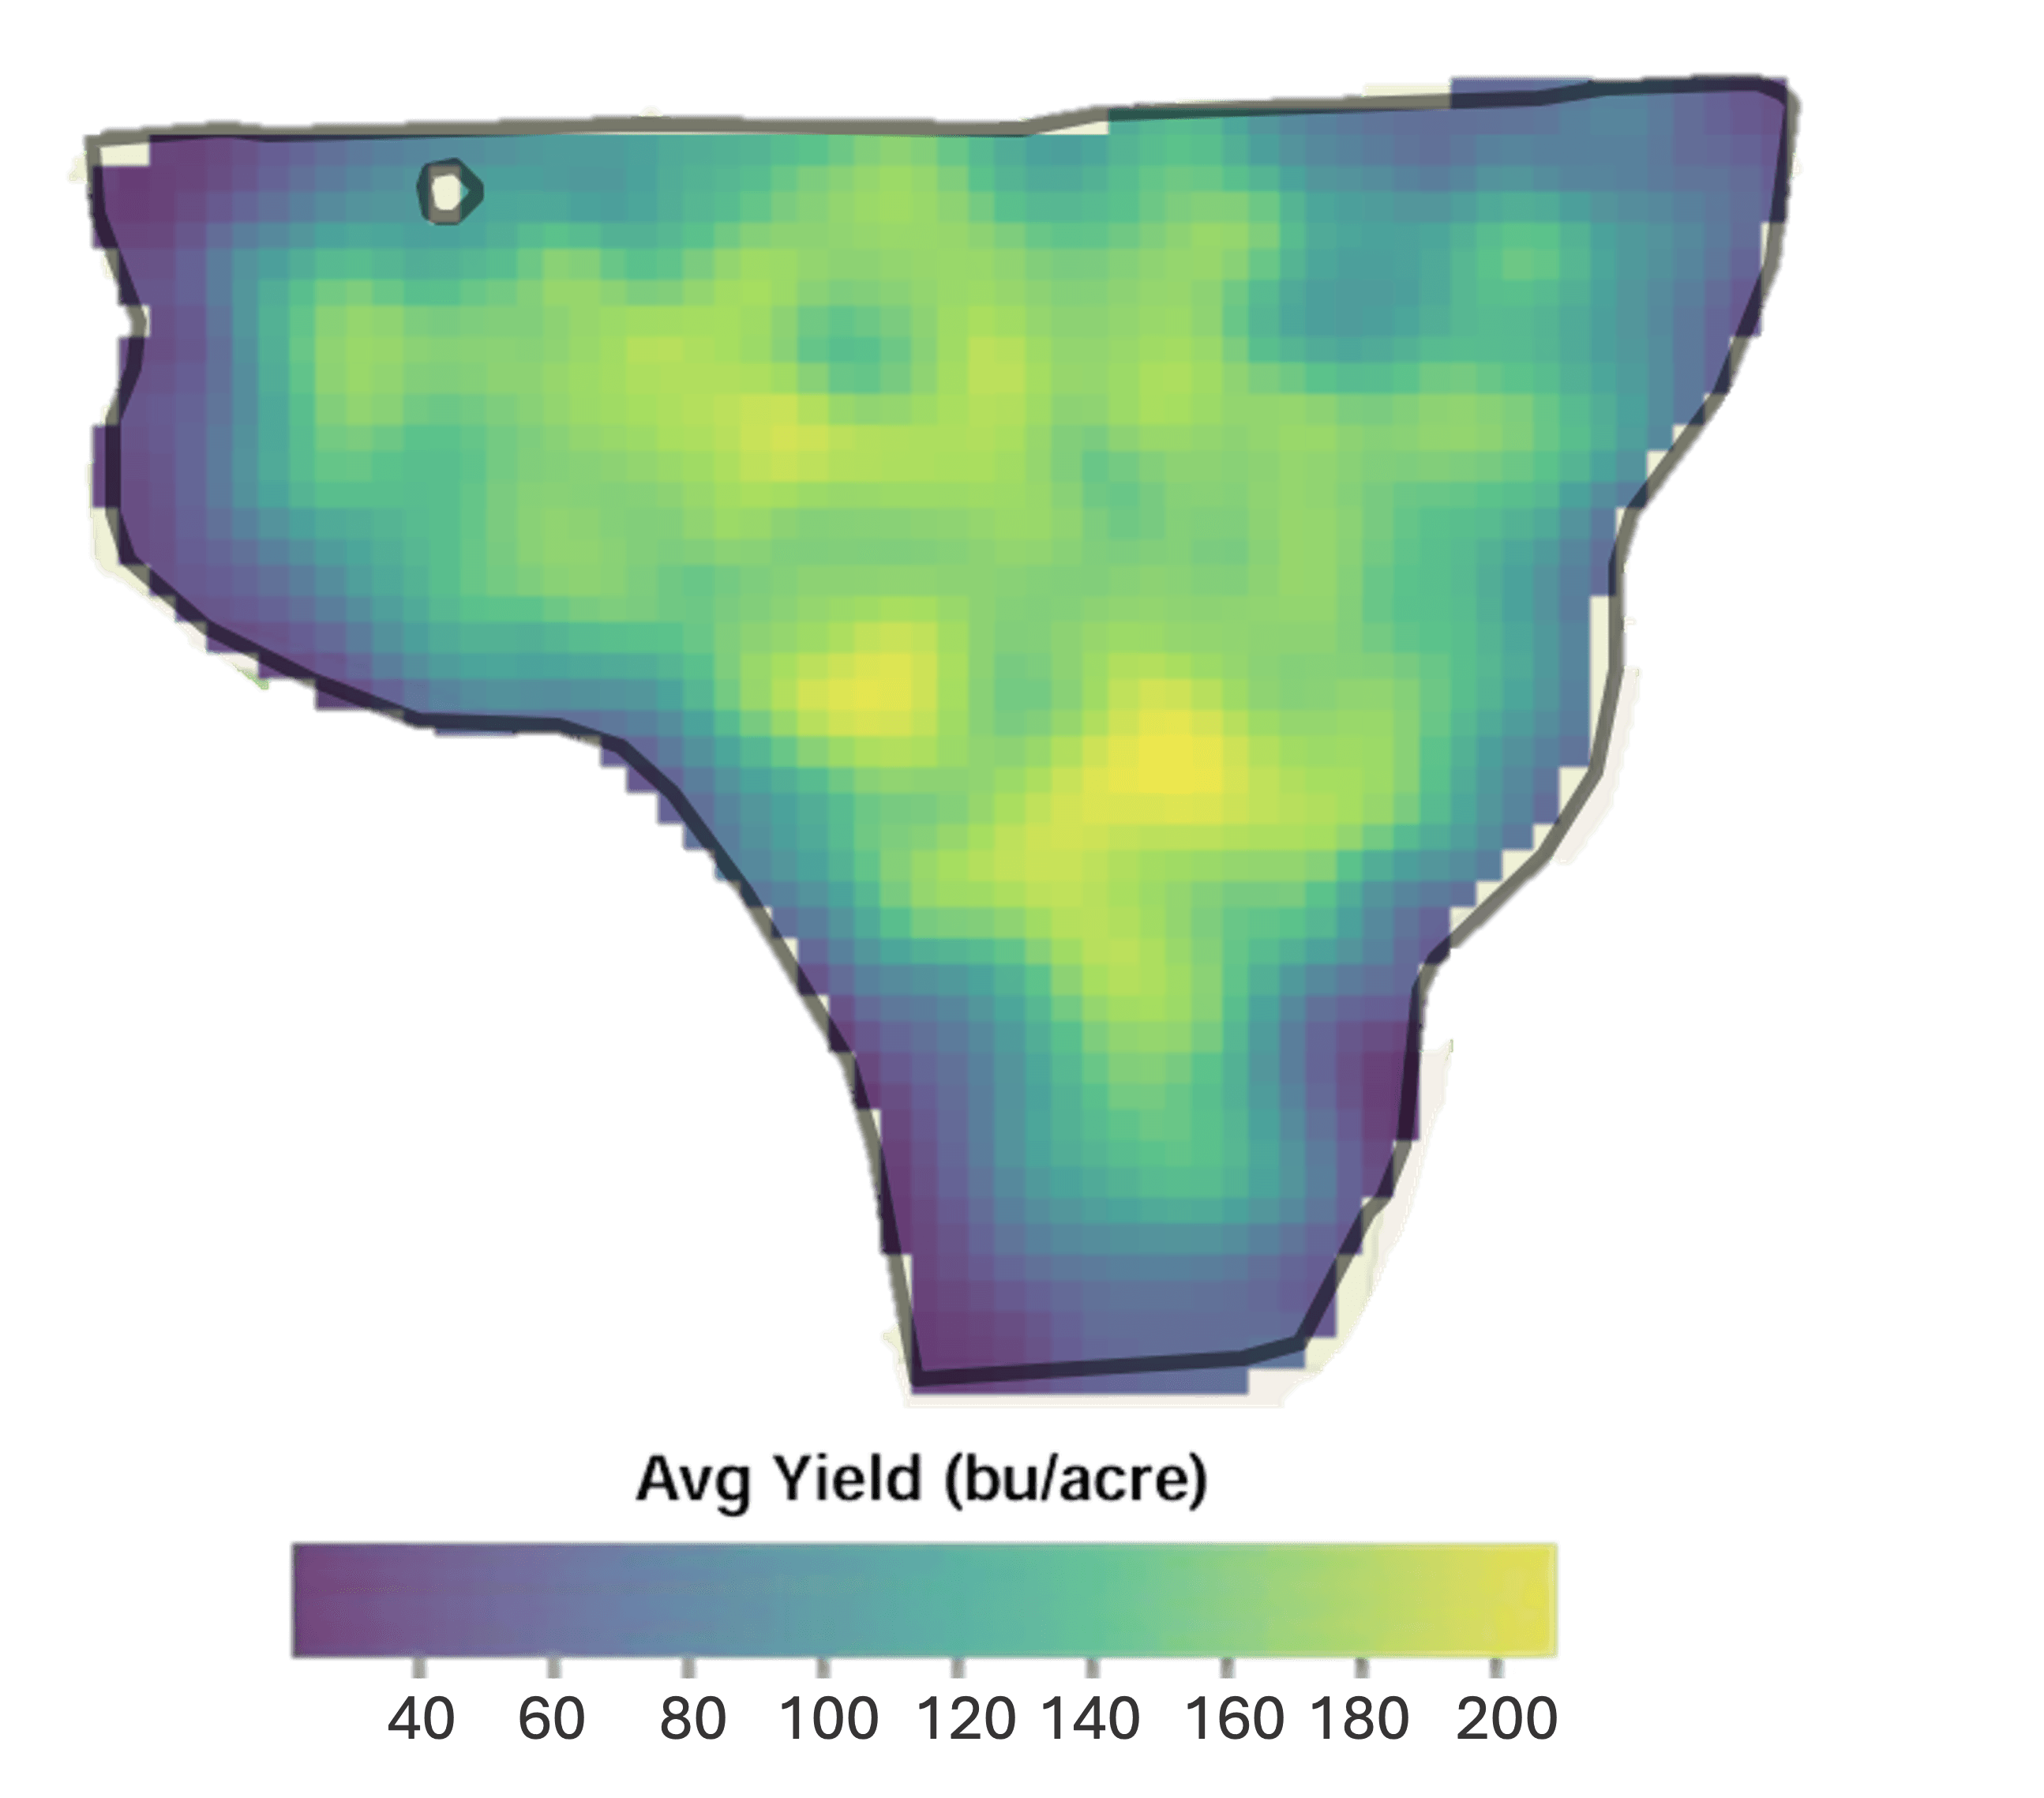
Central Farm-4-23A · Corn · multi-year
Scatterplot
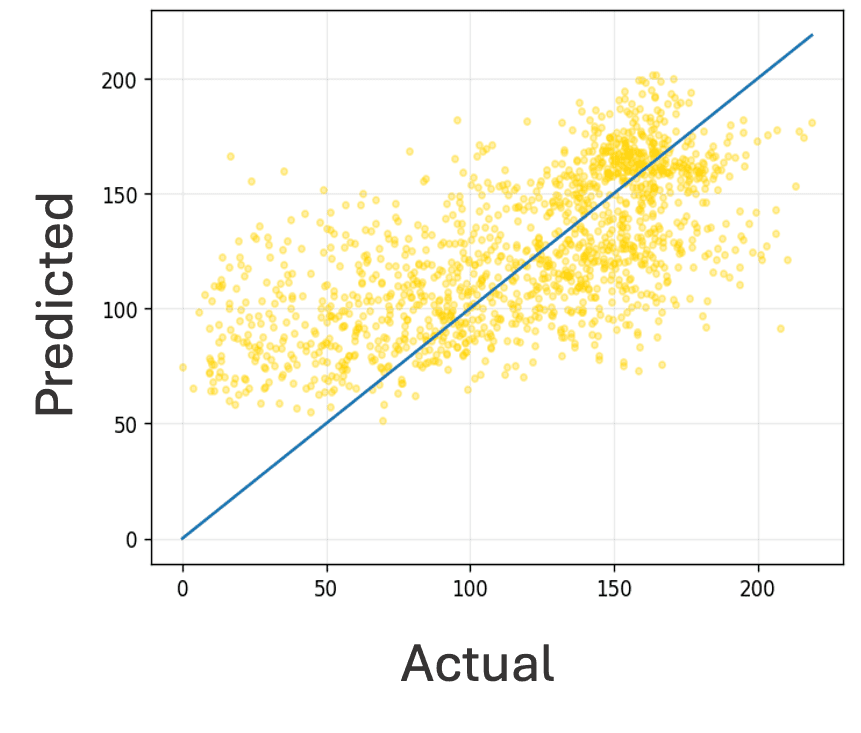
Predicted vs Observed Yield
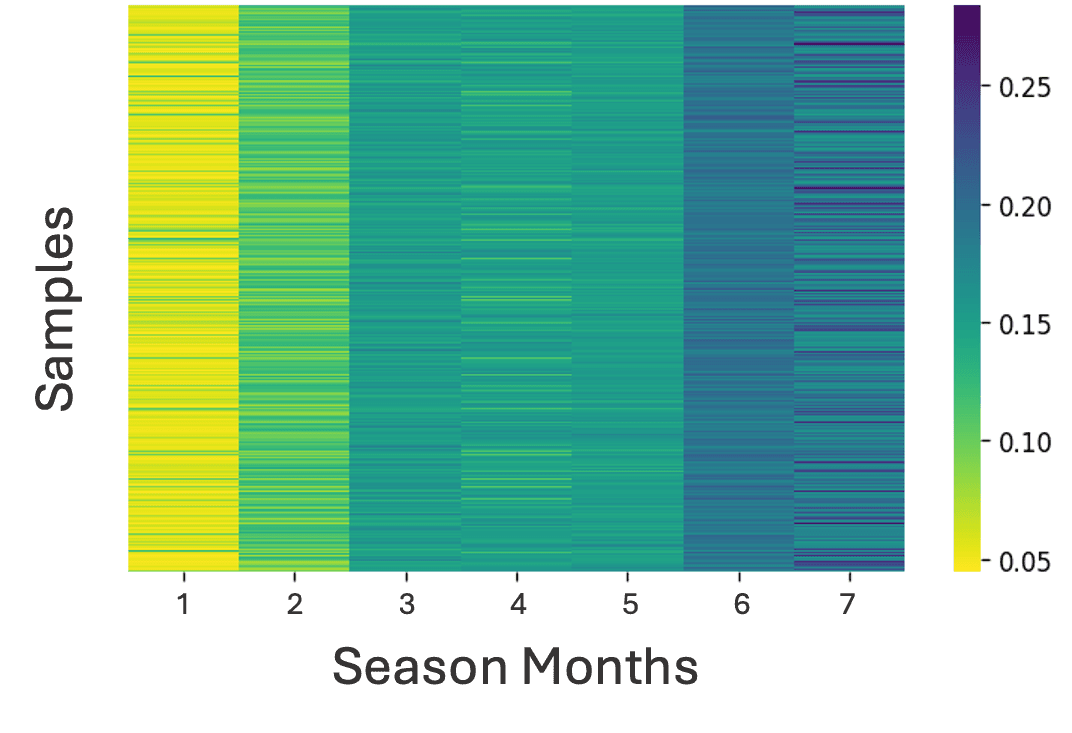
Mean Temporal Attention
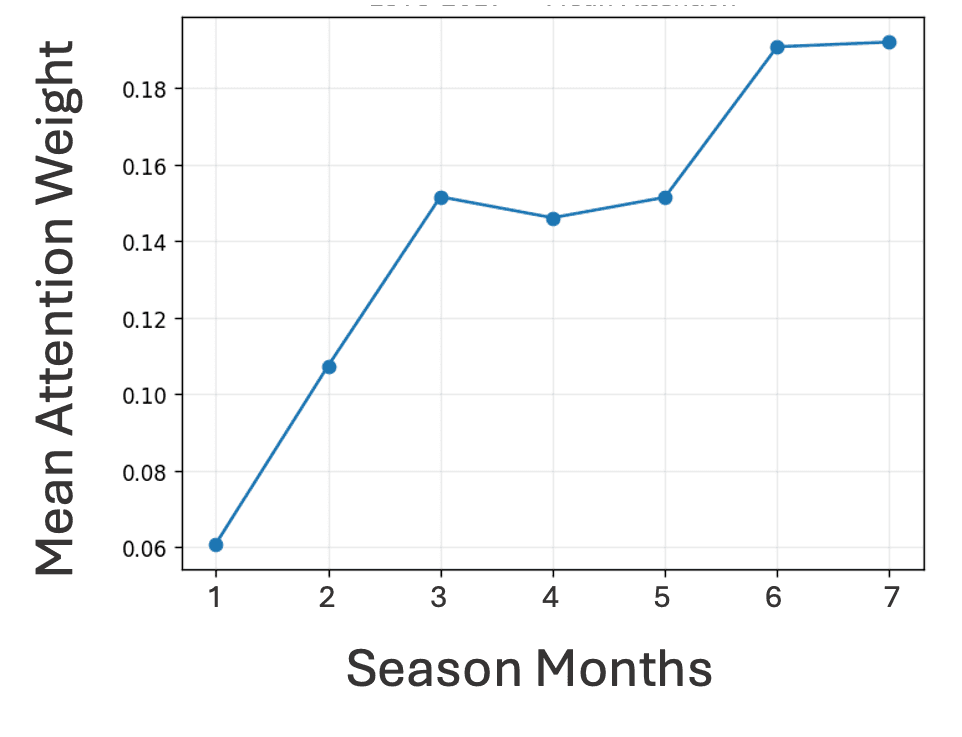
Attention Weights Over Time
Spatial Attention Heatmap
Attention Across the Field
Random Forest (RF)
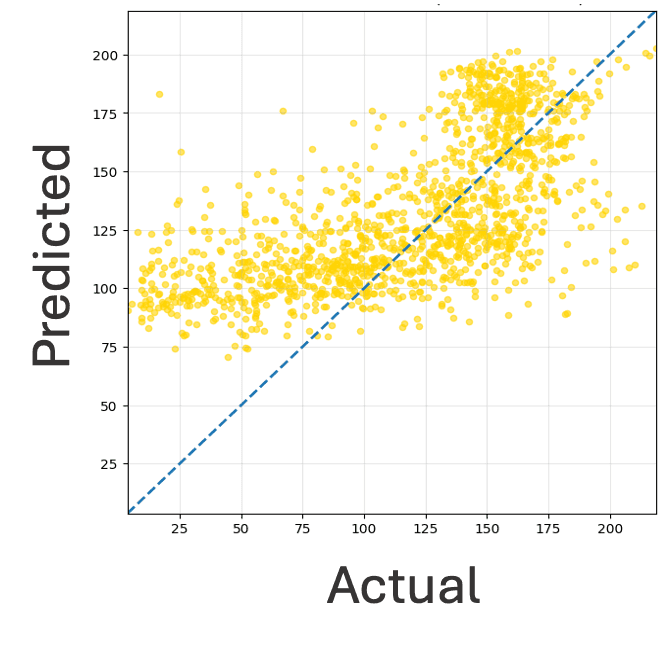
Predicted vs Observed Yield
XGBoost (XGB)
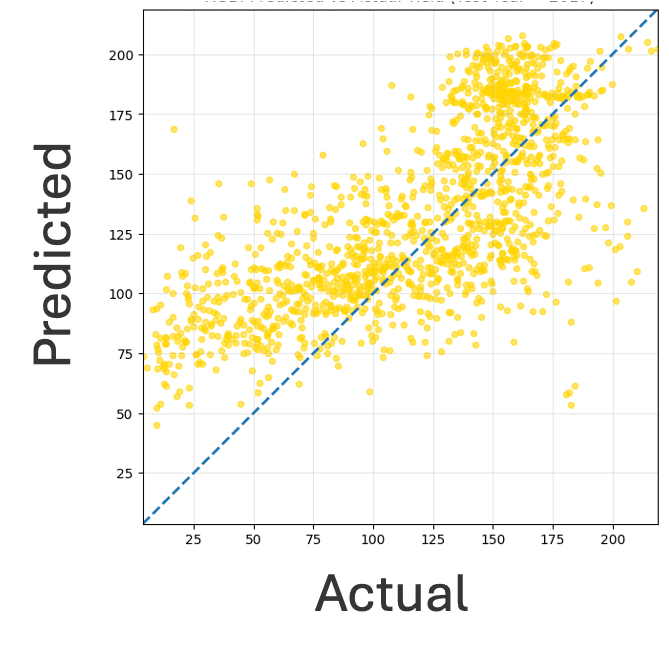
Predicted vs Observed Yield
Conclusion
Key findings from the study
Future Work
Planned directions and next steps
References
Academic sources and citations